Cause & Effect Diagrams
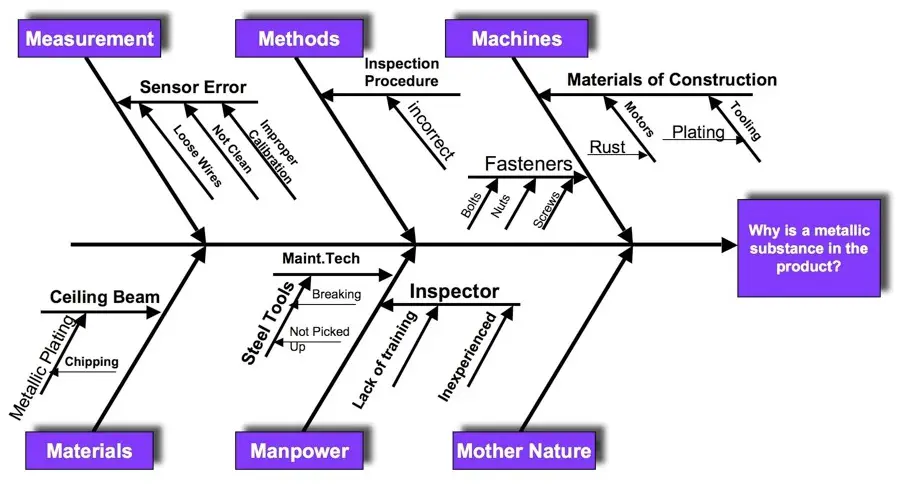
Cause & Effect Diagrams or Ishikawa Diagrams, as they're also known, are one of the graphical tools that are used to check and categorize all the possible causes of a specific problem. Since it looks like a fish skeleton, some people tend to refer to this diagram as a "fishbone diagram" as well.
There are usually certain categories that are always used like the Equipment, Methods, Materials, and Personnel. However, you can choose the most appropriate categories to your own situation.
Understanding exactly what's happening inside your organization and, more specifically, with a system, can help you brainstorm to get some possible ideas in order to identify the possible causes for the problem.