Seven Quality Tools
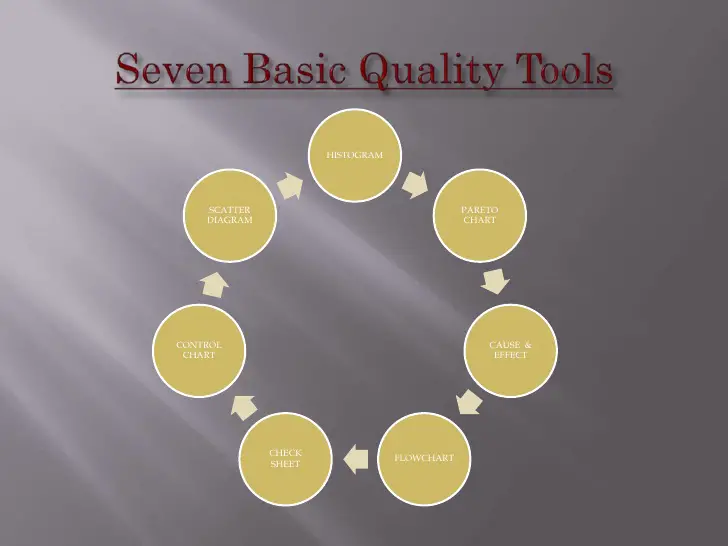
When you think about process improvement, there are many different tools that you can use. Since the process optimization main goal usually is to provide a better value to the customers that are usually translated into high-quality products, the tools used for process optimization usually relate to the quality of the products or services. There are Seven Quality Tools that are the ones that are traditionally used:
- Control Charts
- Scatter Plots
- Histograms
- Cause and Effect Diagrams
- Pareto Charts
- Check Sheets
- Run Charts
Despite Run Charts are still used nowadays, they have been being replaced by either Process Maps or Flow Charts.
- Control Charts
- Scatter Plots
- Histograms
- Cause and Effect Diagrams
- Pareto Charts
- Check Sheets
- Run Charts
Despite Run Charts are still used nowadays, they have been being replaced by either Process Maps or Flow Charts.
